Publications, 2026
Open-Source Machine Learning Computed Tomography Scan Segmentation for Spine Osteoporosis Diagnostics
Neurosurgery, Feb 2026
Clinical Publisher doi:10.1227/neu.0000000000003928 BibTeX
Abstract
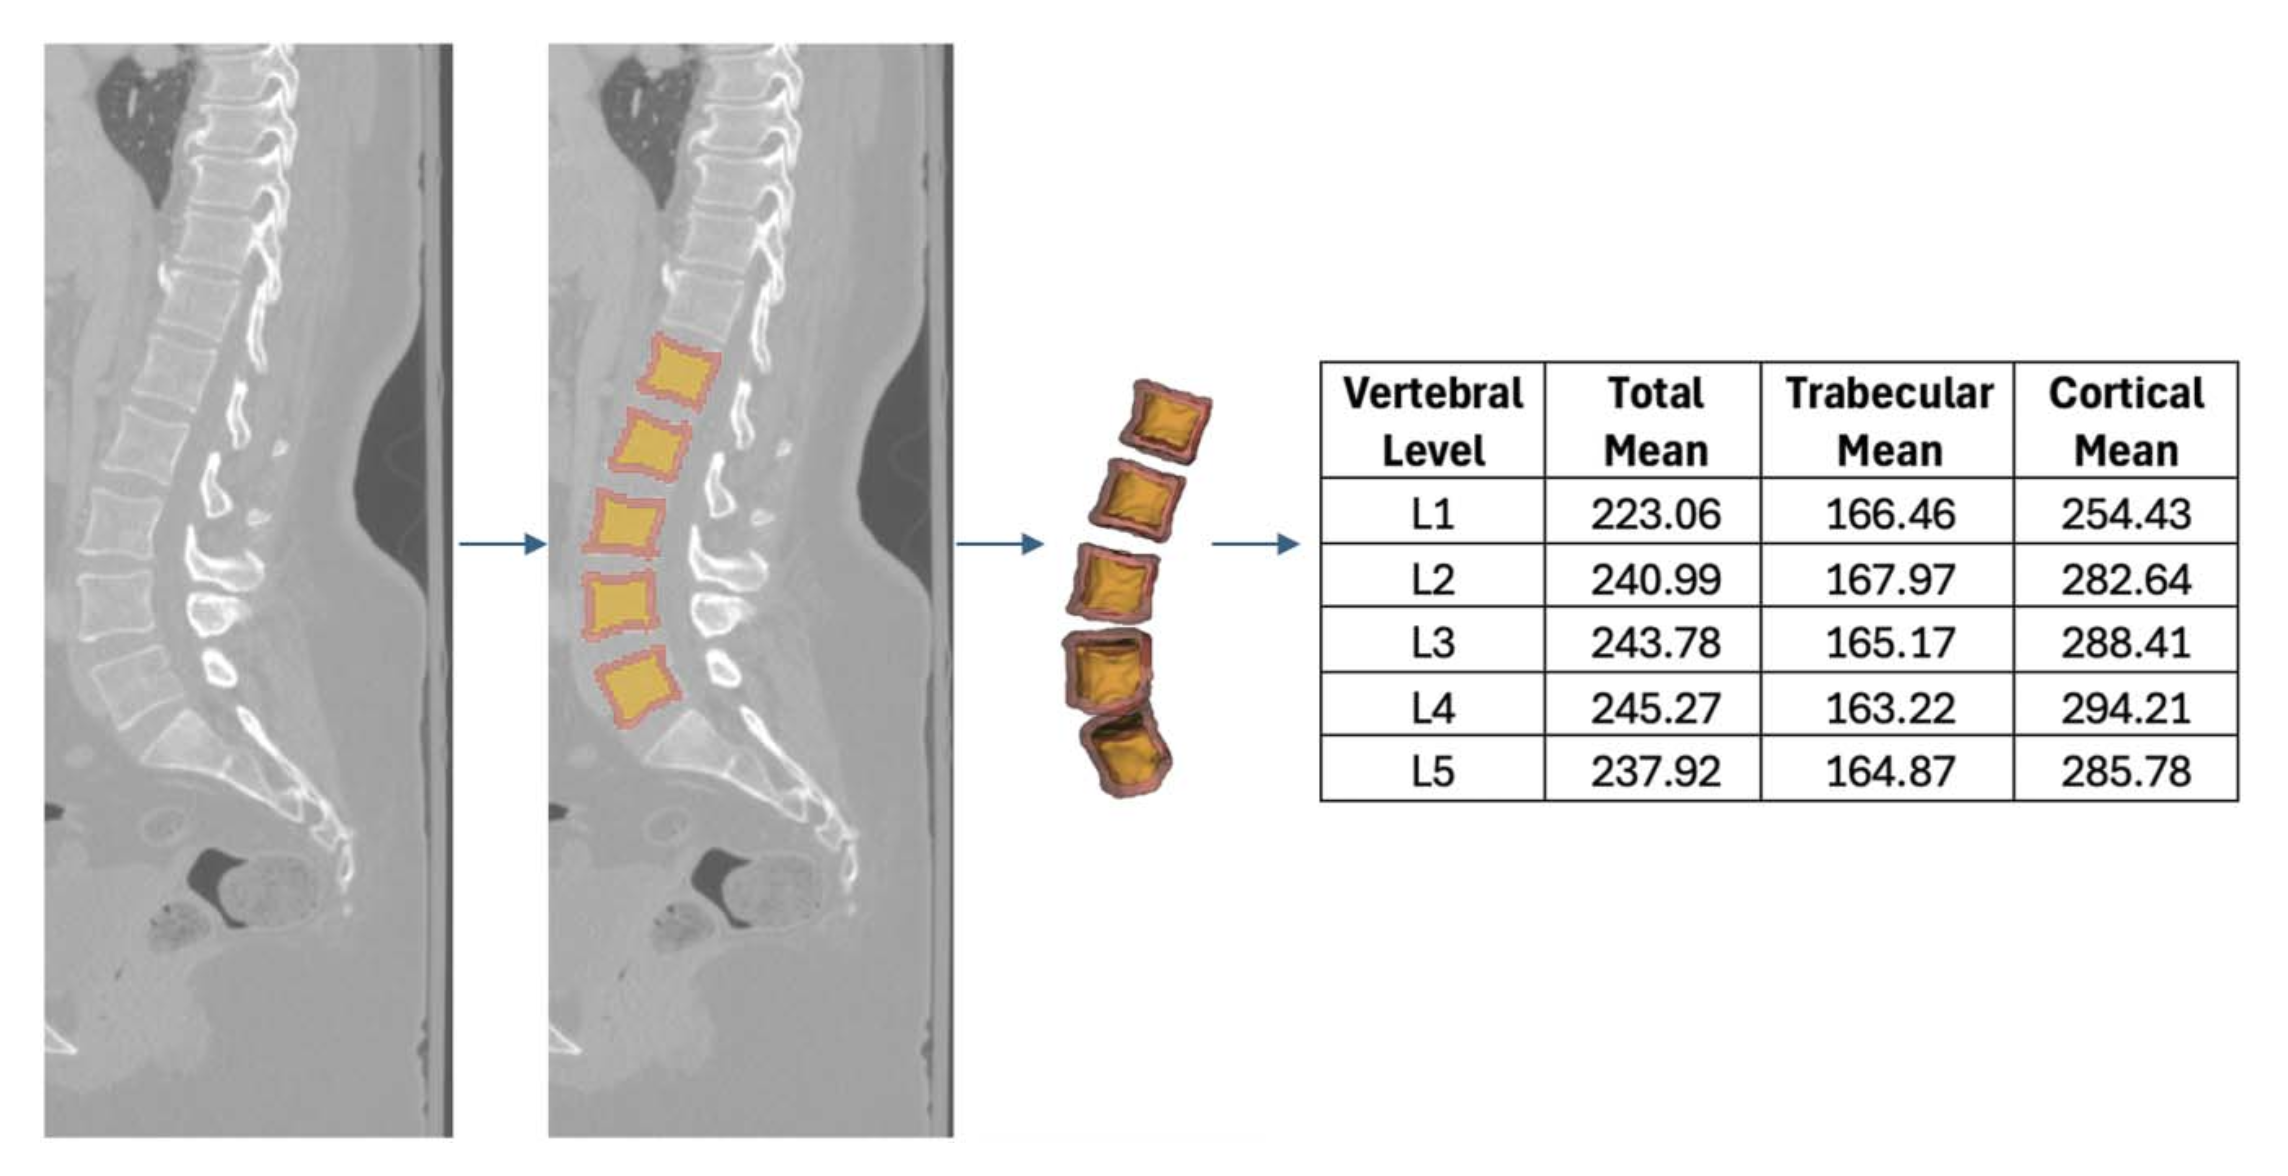
BACKGROUND AND OBJECTIVES: Dual-energy x-ray absorptiometry (DXA) is the standard for assessing bone mineral density (BMD); however, its accuracy is limited by bone architecture, acquisition quality, and clinical context. Hounsfield units (HUs) offer an alternative for osteoporosis risk stratification. Machine learning (ML) models can segment computed tomography (CT) anatomy and integrate HU data to generate BMD metrics previously unavailable. This study elucidates the capabilities of an automated CT segmentation platform and investigates the relationship between vertebral HUs and DXA stratifications of BMD. METHODS: A retrospective analysis of 229 patients with lumbar CT and DXA scans within 1 year was performed. The TotalSegmentator ML model obtained segmentations of the lumbar spine which were integrated with CT radiographic data to compute volume (cm3) and HU density of vertebral bodies, trabecular bone, and cortical bone. Vertebral body HU means were compared against lumbar, hip, and femoral neck DXA T scores in healthy individuals (T-score > −1.0), patients with osteopenia (−1.0 ≥ T-score ≥ −2.5), and patients with osteoporosis (T-score < −2.5) . RESULTS: Patients (85.2% female) had a mean age of 71.02 ± 13.62 years and body mass index of 28.04 ± 7.51 kg/m2. Mean HUs from L1-L5 correlated with femoral neck (r = 0.54, P < .001), lumbar (r = 0.54, P < .001), and hip (r = 0.46, P < .001) DXA T-scores. Compared with osteopenic individuals, healthy individuals had higher L1-L5 total HU (265.0 vs 226.4, P < .001), trabecular HU (179.3 vs 136.5, P < .001), and cortical HU (312.0 vs 274.8, P < .001). The L1-L5 total, trabecular, and cortical bone were predictive for low BMD (area under the curve [AUC] = 0.77, AUC = 0.80, and AUC = 0.75) and osteoporosis (AUC = 0.79, AUC = 0.75, and AUC = 0.80), respectively. Youden Index analysis identified optimal trabecular and cortical bone threshold values of 141.3 HU and 254.2 HU for low BMD as well as 132.3 HU and 249.0 HU for osteoporosis, respectively. CONCLUSION: ML-driven CT segmentation correlates with DXA BMD stratifications and can provide a robust, consistent, and efficient assessment of HU density of critical vertebral structures.
Citations
Cited by 1 work.
BibTeX
@Article{00006123-990000000-02028,
  author={Sankar, Akshay
  and Kann, Michael R.
  and Adida, Samuel
  and Bhatia, Shovan
  and Shanahan, Regan M.
  and Colan, Jhair A.
  and Hurt, Griffin
  and Sharma, Nikhil
  and Kass, Nicolás M.
  and Hudson, Joseph S.
  and Agarwal, Nitin
  and Gerszten, Peter C.
  and Biehl, Jacob T.
  and Legarreta, Andrew
  and Andrews, Edward G.
  and McCarthy, David J.},
  title={Open-Source Machine Learning Computed Tomography Scan Segmentation for Spine Osteoporosis Diagnostics},
  journal={Neurosurgery},
  month = feb,
  year={2026},
  keywords={Segmentation; Osteoporosis; Hounsfield units; DXA; Machine learning},
  issn={0148-396X},
  url={https://journals.lww.com/neurosurgery/fulltext/9900/open_source_machine_learning_computed_tomography.2028.aspx},
  doi={10.1227/neu.0000000000003928},
}